Phenomenon
Natural populations tend to fluctuate. On Isle Royale, both wolf and moose populations have changed over the past five decades in some interesting and surprising ways.
Question
What factors might contribute to the changes we see in population numbers over time?
Model Ideas
Many factors contribute to the changes in moose and wolf numbers on Isle Royale including: food availability, weather, pests and parasites, and certainly the dynamics of the predator-prey relationship. Other factors may also be at work, especially regarding the unexplained and continuing decline of the wolves.
When the number of organisms that are born and survive is greater than the number of deaths, the population increases. When the number of deaths exceeds the number that are born and survive the population decreases. (When births and deaths are relatively equal, the population remains the same.)
Overview
Note: This model could be titled, "Population Dynamics and Human Impacts on Biodiversity" as it explores two related phenomena: (1) the decline of populations and loss of species during recorded human history, and (2) fluctuations in population number in both human-impacted and isolated ecosystems. It is actually the second phenomenon that students use to build their model of population dynamics, but the two phenomena are clearly related and the models are inter-twined. See learning segments below and download the Teacher Overview for more information.
Transition in: Building on what we figured out in UD part 1, we explore biodiversity further and ask questions like “What has happened to biodiversity over time?”, “Why does biodiversity matter?”, and “What are some causes of a loss in biodiversity? Then we study a case of changes in population sizes in a real ecosystem and ask “What factors cause the sizes of populations to fluctuate?”
We begin by asking, “Why should we care about biodiversity?” Students consider its benefit to humans and explore recent losses of species. We then look at data on biodiversity over geologic time scales, recognizing there has always been loss. Looking at recent changes, we note that biodiversity today is decreasing at an unprecedented rate. When biodiversity decreases, what is really happening? Extinction, when there are no more members of a species left. We now ask students to go deeper into the phenomenon of extinction. We ask them to brainstorm possible causes of this decline in biodiversity. We hope that students will recognize the clear role of human activities in declining biodiversity.
To explore population declines and dataset changes, we begin a case study of moose and wolves on Isle Royale. We analyze graphs, read background information, and play a game to build a model that makes a connection between birth and death and population growth and decline. We generate a list of factors that might contribute to population decline but leave open the question of which ones are responsible for the patterns observed on Isle Royale. (If you build in time, there are opportunities to explore this system further at later points in the curriculum. See below.)
After learning about moose and wolf populations in Isle Royale and creating a general model of population dynamics, we return to extinction and consider questions like “What factors might increase the risk of extinction?” and “Where geographically does extinction most occur?” If you want to do the year-long version of Extinction Project, introduce the project here and have students choose their species.
Transition out: Observing that biodiversity has changed over time, we now ask “Why?” We have seen how population sizes of some species have fluctuated and know that biodiversity on Earth changed over time. Do fluctuations in population size play a role in species change? In the next model we'll investigate this by exploring how changing population size affects distribution of traits.
Overall Time: 5 to 7 daysIn this unit, there are many optional extensions to consider. Most of these set you up for further exploration of Isle Royale or extinction in later units.
Optional Curriculum → See the Optional Resources at the end of the Learning Segment Table and the associated notes in the PowerPoint that allow (1) further exploration of the connection between wolves and moose, and (2) a more extensive consideration of the recent decline in the wolf population. These resources set the stage for later explorations described immediately below.
Optional Curriculum → The last option connects the class to the Extinction Project which can be introduced here or at a later time.
Optional Curriculum → Opportunities to go deeper and revisit Isle Royale (1- 2 additional school days throughout the year):
Moose/Wolf population declines can be explored in greater detail as new models are investigated and biological concepts are better understood. Possible revisits of these two populations can happen after several models, but are not required. Here are a few examples of how/when these revisits might be productive:
- After the Model for Energy Flow: Are all interactions between different species predator/prey? Explore one major factor that influenced the decline of both Moose and wolves as parasitic relationships. (Note: This has a direct tie to some of the conversations in Optional Resources A below.)
- Part 1 - Moose (ticks – result of warm temperature) and
- Part 2 - Wolves (parvovirus – introduced by dogs, also worthy to note this was a direct of human impact because the parvovirus was brought in by humans who had domesticated dogs with them.)
- After the Model for Population Variation: What has caused the recent decline of the wolves on Isle Royale? (Note: This has a direct tie to some of the conversations in Optional Resources B below.)
- Part 3 – Climate change has reduced the number of years with an ice shelf for wolves to cross. No immigration means no new alleles into the gene pool.
- Part 4 - Why does this matter? All individuals possess a few potentially harmful recessive and rare alleles that are hidden by dominant, non-harmful ones. These wolves have lost the ability to have reproductive success because they are too closely related and that means they share the same harmful and recessive alleles. The only two wolves remaining are siblings and the male is also the father of the female.
Advanced Planning
Be certain that you have assembled the Moose Simulation Games needed. Please download all materials via the zip file attached (Resources Download - Editable Documents).
1. Students generate ideas addressing, “Why should we care about biodiversity?” The class generates a list of ideas to explore why we care about biodiversity. This is a fairly straightforward conversation. Students privately write their ideas on a Doodle Sheet (for Extinction) before sharing ideas out to the whole class.
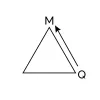
Note: This is implicitly a “question to model” model move because student ideas relate to a model answering “How do humans benefit from ecosystems?” and “What are the connections among members of ecosystems?”
We learned that Biodiversity matters! We generated several reasons why biodiversity is important to the planet and these ideas are posted in the classroom.
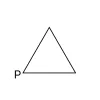
2. Students explore the phenomenon of extinction (recent, historical, and geologic time-scales). Use as many examples of recent extinctions as you like to get students to care about biodiversity. (Many examples are given in the PowerPoint for Model Triangle 1.) Then, the class crafts a definition of extinction. Past student discussions addressed extinct “in the wild” versus universally extinct, the role of zoos in maintaining populations, the difficultly in ever knowing if there are actually NONE left, etc.
We learned about animals that have gone extinct and have noticed the phenomena that there have been several time in the past where a huge portion of species died. We call these mass extinctions. There also appears to be several recent extinctions. Next we work toward trying to understand the connection between past mass extinctions and the alarming increase in extinction today.

3. Students go further with the phenomenon of extinction with a reading that asks if we are currently in the 6thmass extinction. The reading should (if possible) be given as homework, and students should complete the (reading comprehension) questions at the end independently.
Next class period, students work in groups to process the questions and the class holds a short discussion about mass extinctions. Students should be reading across the curriculum to get them thinking about how dire the extinction situation may be. There is some debate whether or not we are really in a “mass” extinction period, but the numbers are alarming.
We have explored the idea of a 6th mass extinction. Your class may or may not have come to a consensus about a 6th mass extinction.

4. Students generate model ideas about the cause of extinction and draw out the import of human impacts on biodiversity. Students brainstorm ideas about what might be behind the recent increase in extinctions. After working in groups, a whole class discussion draws out a common theme of human impacts across many factors. Students generate a few ideas regarding how humans can protect species or mitigate losses. This is a time to implement the use of whiteboards for student group work.
We now understand that humans have long played a role in extinctions. We also have some specific ideas of exactly how humans caused extinctions, but also how humans are trying to save endangered and threatened species.
5. We are introduced to gray wolves and learn of the special case of wolf populations on Isle Royale. We also uncover some of our prior ideas about how populations behave by tracing how we think the wolf population may have changed over the last 50 years.
After an introduction to the history of gray wolves and the role of Isle Royale National Park, students try to recreate the trends in the wolf population numbers over the past 50 years. As they draw their population graph, students articulate factors they believe may be important in regulating the number of wolves. Students will record some of their ideas on their Doodle Sheet for Isle Royale. Record some of the class’s ideas on poster paper or in the PowerPoint. See Teacher Notes for specifics, and MBER Essentials: Make Student Thinking Visible for more general advice.
We’ve been introduced to Isle Royale and have considered some of our initial thinking about how populations might fluctuate in the real world.

6. Students generate some initial ideas about what factors might be affecting the wolves after seeing the wolf population data.
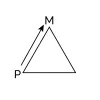
This is really a P to Q to M move. We reveal the wolf population data and hand out copies of the graph to each individual or group so they can mark it up. Ask students if they are surprised by the data and pause to generate a Driving Question for the unit. We also give them at least a brief opportunity to share out some model ideas about what might be behind the dramatic cycles in the wolf population. Questions they have help motivate the readings in the next step of the lesson sequence.
The Isle Royale wolf population has had some large increases and decreases over the past five decades.
With this new information, we have begun to share some initial ideas in response to our driving question. But we also recognize we have a lot of questions and a desire for more data.

7. We read about the island and its wolves and moose. Students share in groups and may expand or revise some of the classroom ideas about what has been causing the wolf population to fluctuate. After seeing the moose data, students also generate ideas about what is causing changes in that population.
This is the first real information they are given about the important factors that affect birth rate and mortality in the Isle Royale ecosystem. Give them the opportunity to revise the posted ideas about what might be at work with the wolf population and to muse briefly about what might be going on with the moose population. Thinking concretely about the moose leads us into the next Learning Segment where we attempt to simulate population change with a game.
The wolves are not the only large animals living on Isle Royale! We have learned about the moose that live there too. We now have several pieces of data to help us make sense of the moose and wolf population change over time.

8. Students play a moose population simulation game to generate data and ideas. Student groups engage in a game that tracks 10 moose through a year on the island. The game explicitly considers the factors likely to affect birth and death rates in the moose population and is directly connected to some information from the readings. Teams keep track of births and deaths and final population numbers.
We’ve found that it is important to let students play at least two rounds of the game in order to get the energy going as well as to solidify some of the connections between the life history of the animals and their population numbers.
*All materials and instructions for the printing and assembling the game are included in the resources download (editable documents).
Note: It’s easiest if the start of this activity falls at or near the beginning of a class period. You can set out the materials ahead of the bell, and students will have plenty of time to play a couple of rounds, while still leaving a bit of processing time at the end of the period. (See next model move.)
The moose have a rough life! There are several factors that affect whether or moose live or die. Students can thus begin to connect real events in the life of moose to a birth and death model that helps us to understand population dynamics.

9. This is where we begin to develop the general model for Population Dynamics. Students process the moose game results and the information from the readings to link changes in population size to the key processes of birth and death.
Students report their game numbers and examine the summarized class data and may begin to recognize the mathematical relationships among the columns of the data table. They then return to the actual trends in the moose population and compare them with the results of the game. A recognition that the simulated population is stable spurs them to consider how a change in the game might better generate data more congruent with the historical shifts in moose over time.
We have all of the pieces we need to articulate the birth-death model for Population Dynamics and are ready to formally develop the model publicly.
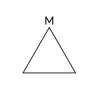
10. We formally develop a general model for understanding changes in population size. The net effect of birth and death cause populations to grow, shrink, or to stay relatively stable over time.
After the class has explicitly processed small chunks of the moose population graph and has had a moment to reflect on what fundamentally drives populations to grow or decline, we are primed to explicitly and formally generate a model for reasoning about changes in population size over time.
Now we have a working model for Change in Population Size. Populations increase when the number born and survive exceed the number of deaths and the population decreases when the number born and survive are less than those that die. If births and deaths happen to be equal, the population doesn’t change.
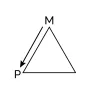
11. We now apply the general model to the specific information we have learned about the Isle Royale ecosystem in order to formally connect the model to our ideas about what is happening with moose and wolf populations.
Now that the class has developed a general (likely mathematical) model for how birth and death regulate populations, we want to be sure to explicitly connect the model back to our thinking about the factors that affect both the moose and wolf populations.
We’ve connected out general birth-death model back to the specifics of the wolves and moose on Isle Royale. Mapping individual factors on to birth and death and reasoning through their combined effect on population growth has helped us to recognize that the model only comes to life in the particulars of any population or ecosystem.
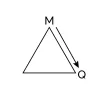
12. We return to our driving question to wrap-up our thinking about both the general model and the wolf population on the island.
Give students a final opportunity to share out lingering ideas, and work with the class to create a representation of the model of population regulation. Leave some buffer time for this activity and be certain to read advice given on the website about creating consensus models, generalizing models (versus leaving them specific), and summarizing models.
Take care in referring to any model as "final" as this can be counterproductive toward students understanding the role of models in science. See teacher notes.
We may still have questions about the specific causes of each annual change in the wolf population, but we’ve answered our driving question using the birth-death model.

13. We use the case of the wolves of Isle Royale to transition back to the phenomenon of extinction and revise our ideas a bit more.
Following Isle Royale, students are asked to re-consider their definition of extinction in the context of local extinction, something that seems to be imminent on Isle Royale. Students explore some of the difficulties in knowing whether a species has gone fully extinct if not on an island.
We’ve revised some of our ideas about extinction. The wolves of Isle Royale are in real trouble, but for a species to go extinct, all populations need to decline and disappear. We’ve also recognized that species on islands are more likely to go extinct and have connected this back to our definition.

14. We pause for a moment and connect back to Unity and Diversity.
This is a quick move that allows us to pause and return to our original phenomenon, changes in biodiversity over time. Here we can leverage the birth-death model for Population Dynamics to create an analogous understanding of how biodiversity changes over time. In this analogous model extinction = (species) death and speciation = (species) birth. Thus the total number of species on the planet can fluctuate over time.
We have applied an analogy to relate the birth-death model to changes in biodiversity over deep time, connecting our ideas in this unit back to Unity and Diversity.

Optional Resources A: Connecting wolves and moose as predators and prey.
These are resources that you can use if/when your students insist on comparing the trends in the wolf and moose populations and want to explicitly consider the link. We have often been taught in our biology courses that predators and prey are tightly linked. Sometimes this is true, but in the case of Isle Royale, the coupling is complicated. The resources here can help students to see that moose are not likely driving changes in the wolves—at least not consistently.
We considered the coupling between the moose and wolf populations but are likely unsatisfied that we have an actual answer as to what is regulating the wolf population across the entire span of the study. We are also left wondering more concretely about the recent decline of the wolves as we now know it isn't about a lack of food (moose).

Optional Resources B: What has happened with gray wolves in recent years?
The resources here provide a bit more exploration of the wolf population on Isle Royale and also what has happened with wolves in general. There is also an optional reading with excerpted information from the Annual Reports available from the Wolves and Moose of Isle Royale website. The reading describes the recent decline of the wolf population to a non-viable set of two and proposes the introduction of new wolves to the island as a conservation solution.
We’ve learned a little more out about the recent decline of the wolf population. We can return to this information later in order to explore ideas around conservation biology or genetics.
Optional Resources C: Introduction to the Extinction Project. End the lesson sequence with an introduction to the Extinction Project if you plan to do the (optional) year-long version. If you are choosing to run the project only as a year-end culmination project, delay introducing it until the appropriate time. See the website for details on both versions of the Extinction Project.
If used across the curricular year, the Extinction Project connects us to various themes in biology. As a culminating project, it is a method toward assessing students’ abilities to connect ideas from throughout the year.
Download Resources
| Attachment | Size |
|---|---|
| Population Dynamics vBio_1.zip | 37.33 MB |
